Blog
Restaurant Revenue Statistics, Trends, and Predictions for 2025

The food service industry is constantly evolving. Whether they own a food kiosk or a fine dining restaurant, it’s essential for restaurateurs and investors to stay current on changes and emerging trends. Considering the average total cost of opening a restaurant in 2025 ranges from $95,000 to $2 million, it’s especially critical to maximize revenue and protect their investment.
At Soundtrack, we’ve collected 15 restaurant revenue statistics that reveal the health of the restaurant business and provide insights to help guide owners in making business decisions.
Let’s get started.
Posted on June 19, 2024
Restaurant Revenue Statistics - Key Takeaways
1. The average restaurant profit margin is climbing (source)
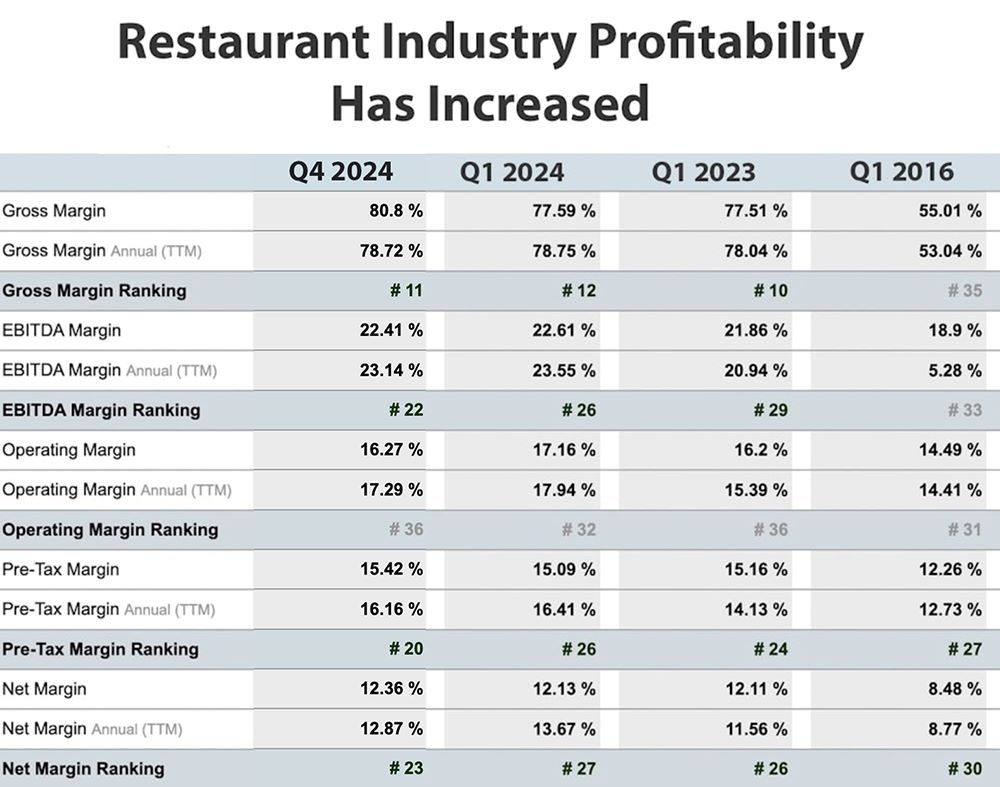
Industry data reveals the average net profit margin for restaurants and dining establishments in Q4 2024 was 12.36%, with a gross margin of 80.8%.
This represents growth from Q1 of that year, when the average net profit margin was 12.13% and the average gross margin was 77.59%—a 1.8% and 4% increase, respectively.
This is a significant increase since 2016 when the study began collecting data. In Q1 of that year, net margin was 8.48% with a 55.01% gross margin. This means net profit margin has increased 3.65% and gross profit margin has increased 22.58% over the past eight years. Although, of course, there have been short-term disruptions such as the COVID-19 pandemic, rising labor costs, and inflation-adjusted profitability.
The profit margin is a vital statistic for potential investors and current restaurant owners as it reflects the profitability of the industry. Restaurants have to balance their expenses carefully, from labor and food costs to overhead expenses, to maintain or increase their profit margins.
2. More than a third of food spending by U.S. consumers goes to restaurants and other food service establishments (source)
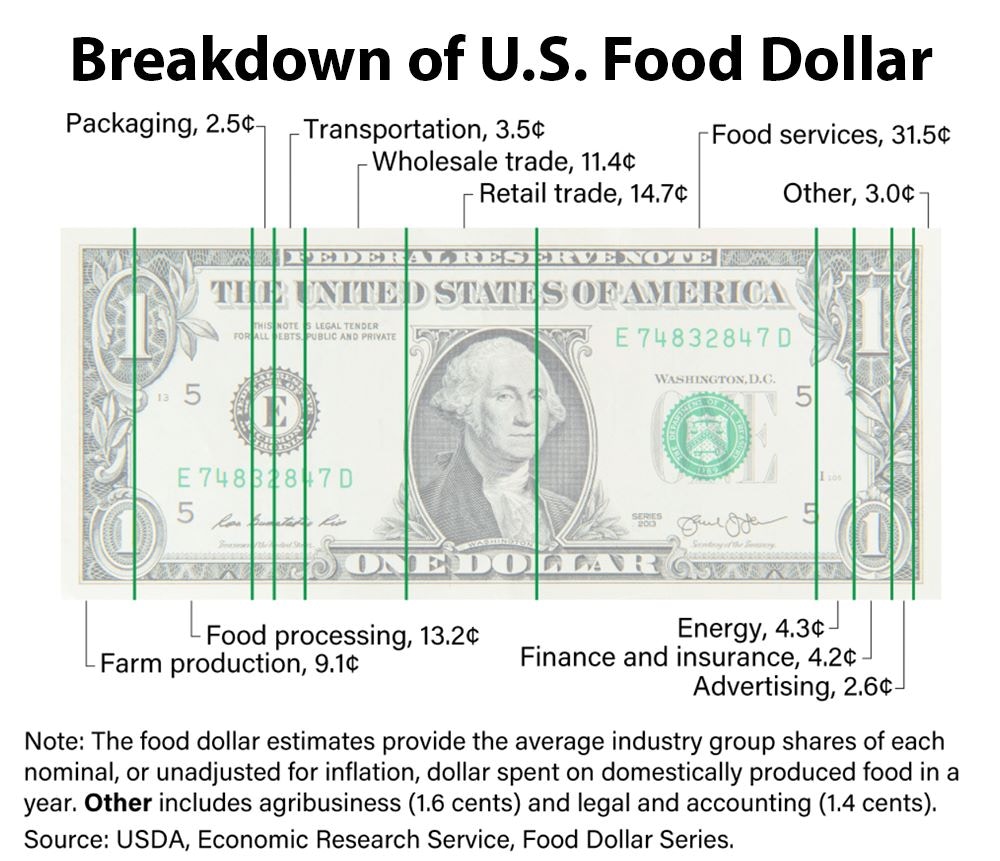
The latest data from the USDA shows an average of 34.1% of every food dollar spent by Americans goes to food services, which include restaurants and other food service establishments.
Over the past decade, dining out expenditures have steadily increased. From 1997 to 2022 spending on food away from home increased by 89%, while spending on food at home increased by 53%.
Additionally, three segments are down to their lowest share in recent years:
Retail trade now accounts for 12.4 cents of the food dollar, the lowest share since 1995.
Wholesale trade represents 10.7 cents, the lowest share since 2011.
Food processing accounts for 14.4 cents, the lowest share since at least 1993.
These shifts indicate that consumers increasingly prefer dining out over traditional food purchases.
By understanding these trends, restaurant operators can better strategize to meet consumer demands and capitalize on the increasing inclination toward dining out.
3. Rising food and inventory costs are the leading source of financial strain for restaurant operators (source)
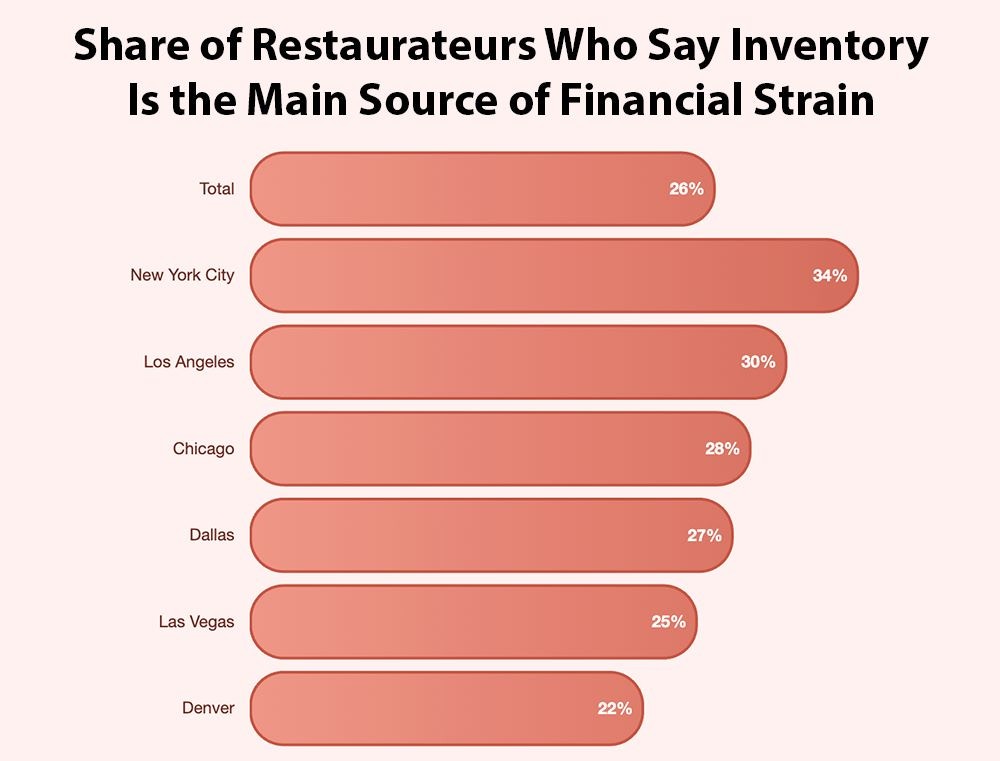
Soaring food and inventory costs are putting significant pressure on restaurant revenue. In 2024, restaurant operators saw a 34% increase in food expenses compared to the previous year, directly cutting into profit margins. According to Touch Bistro’s 2025 State of Restaurants Report, 26% of restaurant operators identified food costs as their biggest financial strain, while 18% cited rising food prices as the top obstacle to business growth.
Important Restaurant Revenue Statistics
Here are important restaurant revenue statistics that will help restaurateurs understand the state of the restaurant industry today—and make data-driven decisions in restaurant management.
4. Restaurant sales increase 9.1% with the right background music, but can drop 4.3% with the ‘wrong’ music (source)
According to an analysis of 1.8 million restaurant purchases, the right background music for restaurants is a mix of hits and lesser known songs that fit their brand.
For example, with the right music:
Dessert purchases increase 15.6%
Soda purchases increase 7.6%
Purchase of hot drinks increases 7.6%
Sale of shakes and smoothies increases 8.6%
Purchase of sides increases 11.1%
Burger purchases increase 8.6%
Sale of fries increases 8.2%
Meanwhile, playing only brand fit hits results in only a 5.5% increase in revenue, and playing music that doesn’t fit the brand can actually hurt sales. This aligns with research that indicates 64% of full-service customers and 47% of limited-service customers prioritize the restaurant experience over the price.
5. A record $1.5 trillion in U.S. restaurant industry sales is projected for 2025 (source)
This milestone highlights the restaurant industry’s robust recovery from the pandemic and economic downturn of recent years and shows the industry’s massive economic impact. As a result of this growth, the industry is projected to create 200,000 jobs by the end of 2025, increasing total employment by the industry to 15.9 million Americans.
6. The online food delivery market is expected to reach $563.39 billion in the U.S. by 2029 at a compound annual growth rate (CAGR) of 6.99% (source)
By the end of 2025, the U.S. online food delivery market is projected to reach $429.95 billion, a 21.7% revenue change for the year.
This includes a projected 2025 market volume of $133.44 billion for the meal delivery market and $327.91 billion for the grocery delivery market, which is expected to grow 11% in 2026.
User penetration in the meal delivery market is projected to reach 52.6% in 2025, with 192.5 million Americans ordering meals for delivery in 2029.
For comparison, the total market share in 2017 was $66.18 billion, including $23.38 billion for meal delivery and $42.8 billion for grocery delivery. The meal delivery market share alone has grown by $329.9 billion over the course of seven years.
7. Operators report an average 33% increase in off-premise sales over the previous year (source)
Complementing the expanding food delivery market explored in the previous statistic on this list, 82% of restaurant operators surveyed in Touch Bistro’s 2025 report say delivery or takeout sales increased compared to the previous year.
Overall, 25% of operators said takeout sales significantly increased, while 57% said they slightly increased. Meanwhile, 17% of operators said takeout sales remained the same and 1% said takeout sales slightly decreased. No restaurant operators reported a significant decrease in takeout or delivery sales.
8. 99% of full-service restaurant operators report an increase in labor costs (source)
In addition to food and inventory costs, labor costs are a significant concern among restaurant operators. Driven by increasing minimum wage rates and salary expectations among workers, payroll is the leading labor challenge among survey respondents.
To combat this challenge, 39% of operators are focusing on increasing productivity, while 36% are focusing on increasing retention and 35% are embracing technology to mitigate rising labor costs.
9. Happy hour sales account for 60.5% of a restaurant or bar’s revenue (source)
Happy hours are a significant revenue driver for bars and restaurants with alcohol service. These promotions attract customers during off-peak hours, boosting overall sales and profitability.
The average bill during happy hour is $68.99, approximately $8 more than the average bill during other times of day.
10. Restaurants typically invest 3-6% of their revenue into marketing (source)
Effective marketing strategies are essential for attracting new customers, retaining existing customers, and driving sales growth.
In addition to other strategies for increasing restaurant revenue, like building a strong social media presence, establishing loyalty programs, and managing online reviews, marketing helps restaurants promote their brand and increase visibility in a competitive market.
Allocating a portion of sales to marketing is essential for new restaurants and small businesses as well as chain restaurants with locations all over the world.
11. Restaurants waste an estimated $25 billion worth of food annually (source)
Reducing food waste can significantly impact a restaurant’s bottom line and sustainability efforts. Here are some startling food wastage statistics:
American restaurants create 22 to 33 billion pounds of food waste annually.
Approximately 4 to 10% of food purchased by restaurants is wasted before reaching customers.
An average of 17% of the food on a customer’s plate is not eaten.
Customers leave 55% of leftovers on the table.
12. As of January 2025, the inflation rate has dropped to 3%, signaling stability for the restaurant industry (source)
Easing economic pressures, such as rebounding consumer spending and recent declines in inflation and interest rates point to renewed growth for the restaurant industry in 2025.
While three quarters of Americans are concerned about food price increases, inflation has decreased from its 40-year peak in 2022.
The Federal Reserve’s Federal Open Market Committee (FOMC) held interest rates steady after its first meeting of the year in January, following three consecutive rate cuts in late 2024 that brought the federal funds rate to a target range of 4.25% to 4.50%. This followed 14 months of stagnancy.
With potentially greater economic stability on the horizon, restaurants are well-positioned to capitalize on new opportunities, invest in innovation, and drive revenue growth in the coming year.
13. 42% of restaurant operators report automation has led to more productive staff (source)
In the same survey, 41% of restaurant operators reported an increase in sales and 40% reported business growth. Additionally, 34% reported saving money and 37% reported saving time.
Roughly half of survey respondents have begun automating day-to-day business operations, such as online ordering, invoicing, and email marketing.
14. 73% of operators are using Facebook to drive revenue (source)
Meanwhile, 59% of surveyed restaurant operators are using Instagram, 54% are using X (formerly Twitter), 48% (up from 23% the previous year) are using TikTok, and 31% are using Snapchat.
In total 99% of restaurant operators report using at least one social media platform to establish an online presence for their restaurant.
15. 89% of operators support the use of AI in their restaurants (source)
Of surveyed restaurant owners, presidents, and managers, nearly nine out of 10 embrace artificial intelligence (AI) as a tool for increasing the efficiency and profitability of their restaurants.
What These Restaurant Revenue Statistics Reveal
Understanding these insights can help restaurant owners, investors, and stakeholders understand current trends, project future directions of the industry, and make informed decisions.
The industry is resilient to challenges and stronger than ever
With record sales projected for 2024, the restaurant industry is surging ahead. This is partially driven by the fact that, despite increased costs, approximately 90% of adults enjoy eating at restaurants.
This robust consumer demand for a restaurant dining experience highlights the importance of adapting to changing market conditions to capitalize on this growth.
Labor and cost management are key
Assuming labor costs will constitute approximately 30% of gross revenue, effective labor management is crucial for maintaining profitability.
Ongoing labor shortages and wage inflation necessitate innovative solutions to manage these costs. Automation and efficient use of POS systems can help reduce labor expenses without compromising service quality.
Additionally, offering competitive wages and benefits can help attract and retain skilled restaurant employees, further enhancing operational efficiency.
To manage rising food prices, reducing food waste and embracing sustainability are critical
With profit margins already tight, managing food costs effectively is crucial for sustaining revenue and long-term profitability. Restaurants must explore strategic pricing, supplier negotiations, and waste reduction to offset these increasing expenses.
Restaurants waste billions of dollars worth of food annually. This is driven by:
Increasingly large portion sizes.
Extensive menu choices
Inflexibility of chain store management.
Over-preparation of food.
Failure to utilize food scraps.
The practice of keeping buffets fully stocked.
Improper ingredient storage.
For perspective, portion sizes have grown to two to eight times larger than FDA or USDA standard servings.
Reducing food waste not only improves a restaurant’s bottom line but also aligns with growing consumer demand for sustainable practices. Implementing effective food inventory management and waste reduction strategies can lead to cost savings and improved sustainability.
For example, one organization helped reduce food waste by $318 million in 2023, which represents roughly 1.2% of total food sales.
Strategic partnerships with food delivery services will be an increasingly important revenue stream for restaurants
For people with increasingly busy lifestyles, online food delivery can be even more convenient than takeout—and that’s exactly what’s driving the market growth in the United States.
In response, restaurants are investing in delivery infrastructure and partnerships with third-party services to capture this growing market, evidenced by restaurants adopting platforms like Grubhub, DoorDash, Uber Eats to allow customers to order food for off-premise eating.
AI and automation will help boost profitability
AI and automation are increasingly being used to enhance operational efficiency. Examples include AI-driven menu pricing, automated customer service, and predictive analytics for inventory management. Restaurants that adopt AI solutions are seeing cost savings and improved customer experiences.
Other technology upgrades such as self-service kiosks, dynamic pricing, robotics, POS system upgrades, and mobile apps can boost revenue and efficiency in restaurant operations.
Digital marketing and social media are critical
Restaurant revenue statistics show social media continues to be a powerful revenue driver, with platforms like Facebook, Instagram, and TikTok playing a significant role in customer engagement. Strategies like influencer partnerships, user-generated content, and targeted ads can increase brand awareness and customer loyalty.
Placing a stronger focus on experiential dining will help increase customer retention
Consumers prioritize experiences over price, meaning restaurants that offer unique dining experiences can charge a premium. Loyalty programs and personalized promotions based on customer data can enhance repeat business and customer retention. Playing the brand-fit music can contribute to the perfect ambiance and strengthen the restaurant’s brand.
Adapting to consumer preferences for health and sustainability will be essential
With increasing demand for sustainable and healthier food options, restaurants that adapt to these preferences can capture a growing market segment. Implementing farm-to-table sourcing, plant-based menu options, and eco-friendly packaging can boost brand reputation and sales.
How to Improve Restaurant Revenue
Restaurant owners with fast-food franchises, fast-casual dining establishments, and full-service restaurants can leverage emerging technology, improve cost management, and expand service offerings to enhance profitability and help ensure long-term success.
The potential revenue generated from offering special promotions like happy hours and playing the right background music make these important elements for a revenue growth strategy.
However, it’s important to remember that you can’t simply stream your personal Spotify account in your restaurant without risking a lawsuit.
Soundtrack is a commercial music streaming service that provides access to more than 100 million fully licensed tracks and over 1,300 playlists. It’s the only service that lets you legally play what you want, when you want, in a business establishment.
The service is also unique in that it offers an AI Playlist Creator that allows you to generate brand-fit playlists from simple text prompts, and Soundtrack even makes it possible to legally import your playlists from Spotify.
Ready to get started?
See how Soundtrack works for you and your business. Get our most exclusive features with a no obligation 14 day trial, unlocking everything available in Soundtrack Unlimited.